Search results for visualization
FiltersJSON
Portal
3,171 datasets for “visualization”
- Opendatasoft hubLive preview
Interne - Critères GFP OFGL [2025]
INTERNEUpdated 20 Jul 2026
… Il est nécessaire aux data-visualisations.
- CSV
- JSON
- GEOJSON
- ODS API
- GovData Germany
Bauprojekte städtische Gebäude Köln
Open.NRWUpdated 12 Nov 2026
… Eine Visualisierung findet man hier: http://www.stadt-koeln.de/politik-und-verwaltung/gebaeudewirtschaft/bau-projekte/
- JSON
- Socrata networkLive preview
Electronic Police Report 2012
Police Department (NOPD)Updated 30 Jun 2026
… All data visualizations on maps should be considered approximate and attempts to derive specific addresses are strictly prohibited …
- CSV
- JSON
- SODA API
- Opendatasoft hubLive preview
Nombre de clients Gaz consommateurs raccordés au réseau SOREGIES - par maille IRIS et par segment
SOREGIESUpdated 8 Jul 2021
Ce jeu de données est lié à la visualisation suivante : Visualisation - Nombre de clients Gaz consommateurs raccordés au …
- CSV
- JSON
- GEOJSON
- ODS API
- Opendatasoft hubLive preview
File d'attente des installations de production d'énergies renouvelables en attente de raccordement sur le réseau SRD - par filière
SRDUpdated 24 Feb 2025
Ce jeu de données est lié à la visualisation suivante : Visualisation - File d'attente des installations de production …
- CSV
- JSON
- GEOJSON
- ODS API
- Socrata networkLive preview
Maryland_Military_Training_Route_1_500___Above
opendata.maryland.govUpdated 22 Jul 2025
… Routes are divided into visual rules (VR) and instrument rules (IR, at night and in poor weather conditions …
- CSV
- JSON
- SODA API
- data.gouv.fr
Stations en open-data du réseau météorologique Infoclimat (Réseau StatIC)
Association InfoclimatUpdated 25 May 2022
… BY-NC) 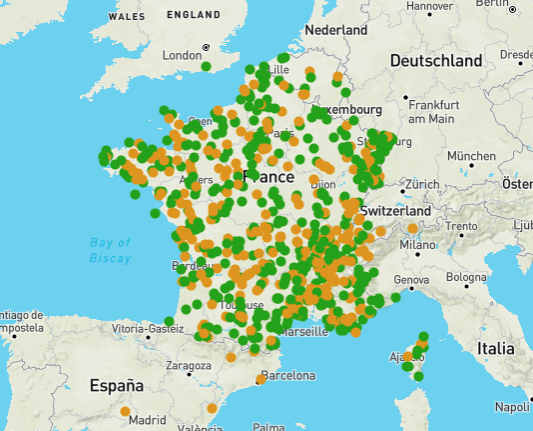
- JSON
- data.gouv.fr
RefEA : Liste des établissements proposant des formations agricoles 2026-2027
Ministère de l'Agriculture, de l'agro-alimentaire et de la souveraineté alimentaireUpdated 9 Nov 2026
Ce jeu de données est lié à la visualisation suivante : [Visualisation - RefEA : Liste des établissements proposant des formations …
- CSV
- JSON
- ZIP
- Opendatasoft hubLive preview
Panorama de la consommation Gaz raccordée sur le réseau SOREGIES - par Département
SOREGIESUpdated 8 Jul 2021
Ce jeu de données est lié à la visualisation suivante : Visualisation - Panorama de la consommation Gaz raccordée sur …
- CSV
- JSON
- GEOJSON
- ODS API
- Opendatasoft hubLive preview
Panorama de la consommation Gaz raccordée sur le réseau SOREGIES - par segment
SOREGIESUpdated 8 Jul 2021
Ce jeu de données est lié à la visualisation suivante : Visualisation - Panorama de la consommation Gaz raccordée sur …
- CSV
- JSON
- GEOJSON
- ODS API
- Opendatasoft hubLive preview
Cementerios
Diputación Provincial de Castelló/CastellónUpdated 2 Nov 2026
Este dataset tiene asociada la siguiente visualización: Mapa cementerios . Cementerios existentes en las distintas poblaciones de la provincia …
- CSV
- JSON
- GEOJSON
- ODS API
- Opendatasoft hubLive preview
Genoscapist
Dérozier, SandraUpdated 22 Dec 2020
Lien vers la fiche source Genoscapist is a web-tool generating high-quality images for interactive visualization of …
- CSV
- JSON
- GEOJSON
- ODS API
- Opendatasoft hubLive preview
Ma région : Maladies à Signalements Obligatoires
Updated 23 Sept 2026
Jeu de données permettant d’alimenter les visualisations Maladies à signalement obligatoire de la page Ma Région.
- CSV
- JSON
- GEOJSON
- ODS API
- Opendatasoft hubLive preview
Tree Hollows - Community reported
City of Greater GeelongUpdated 13 Nov 2026
… These can be visualised on the Urban Forest dashboard .
- CSV
- JSON
- GEOJSON
- ODS API
- data.gov.au
Tree Hollows - Community reported
City of Greater GeelongUpdated 24 Sept 2026
… These can be visualised on the Urban Forest dashboard.
- CSV
- JSON
- GEOJSON
- KML
- SHP
- XLS
- Socrata networkLive preview
Histórico Mensual de Escorrentía por Subzona Hidrográfica
Instituto de Hidrología, Meteorología y Estudios Ambientales - IDEAM, Bogotá D.C.Updated 16 Sept 2026
… Los datos a visualizar o descargar a continuación no han sido validados por el IDEAM. 2. Los datos …
- CSV
- JSON
- SODA API
- Data.gov Catalog
Hayward M7.0 Earthquake Scenario
data.sf.govUpdated 1 Oct 2026
… For Visualization: ≤ 5.5 = Light ≤ 6.5 = Moderate ≤ 7.5 = Strong ≤ 8.5 = Very Strong ≤ 9.5 = Violent
- JSON
- XML
- CSV
- VND.GOOGLE-EARTH.KML+XML
- VND.GOOGLE-EARTH.KMZ
- GEO+JSON
- data.gov.uk
Strule Network Contribution
OpenDataNIUpdated 7 Aug 2021
… What can you do with the layer? Visualisation: This layer can be used for visualisation online in web …
- JSON
- GEOJSON
- KML
- CSV
- HTML
- data.gov.uk
Ballinderry Network Contribution
OpenDataNIUpdated 7 Aug 2021
… What can you do with the layer? Visualisation: This layer can be used for visualisation online in web …
- JSON
- CSV
- GEOJSON
- HTML
- KML
- data.gov.uk
Strangford Network Contribution
OpenDataNIUpdated 7 Aug 2021
… What can you do with the layer? Visualisation: This layer can be used for visualisation online in web …
- KML
- CSV
- JSON
- GEOJSON
- HTML